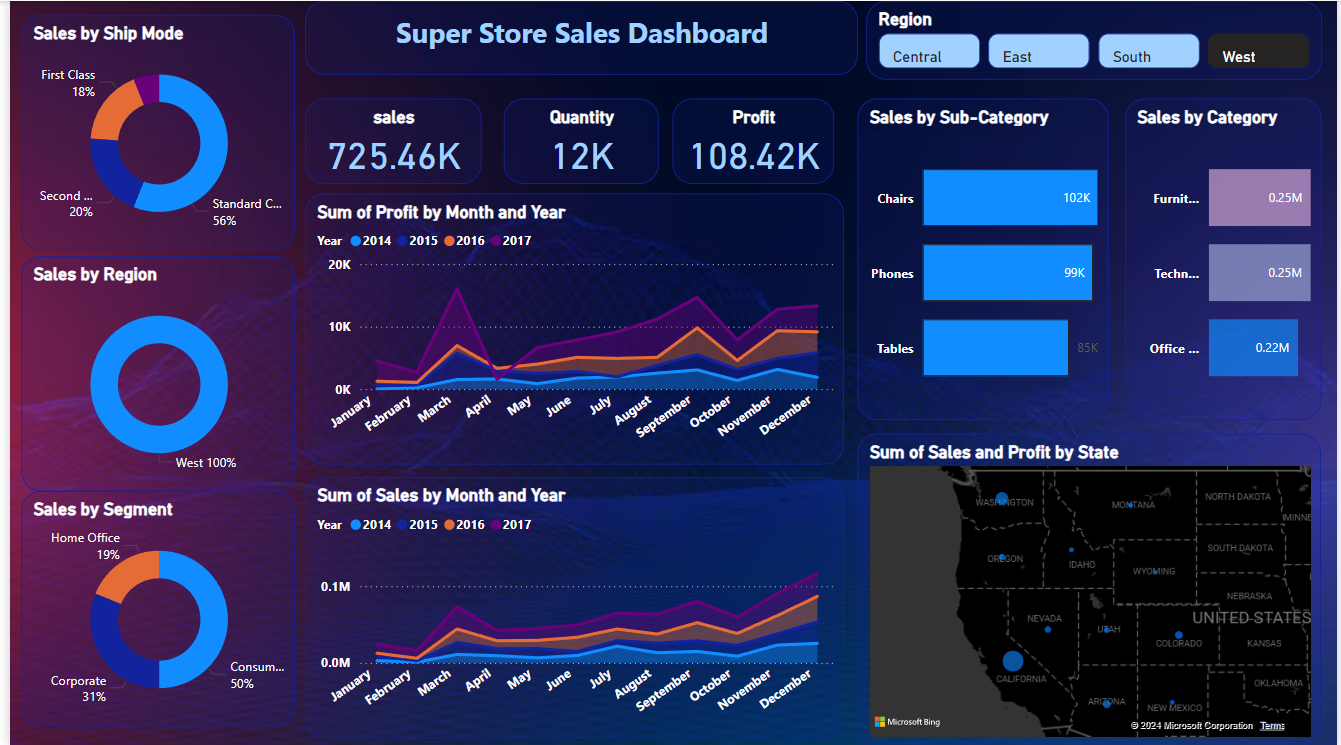
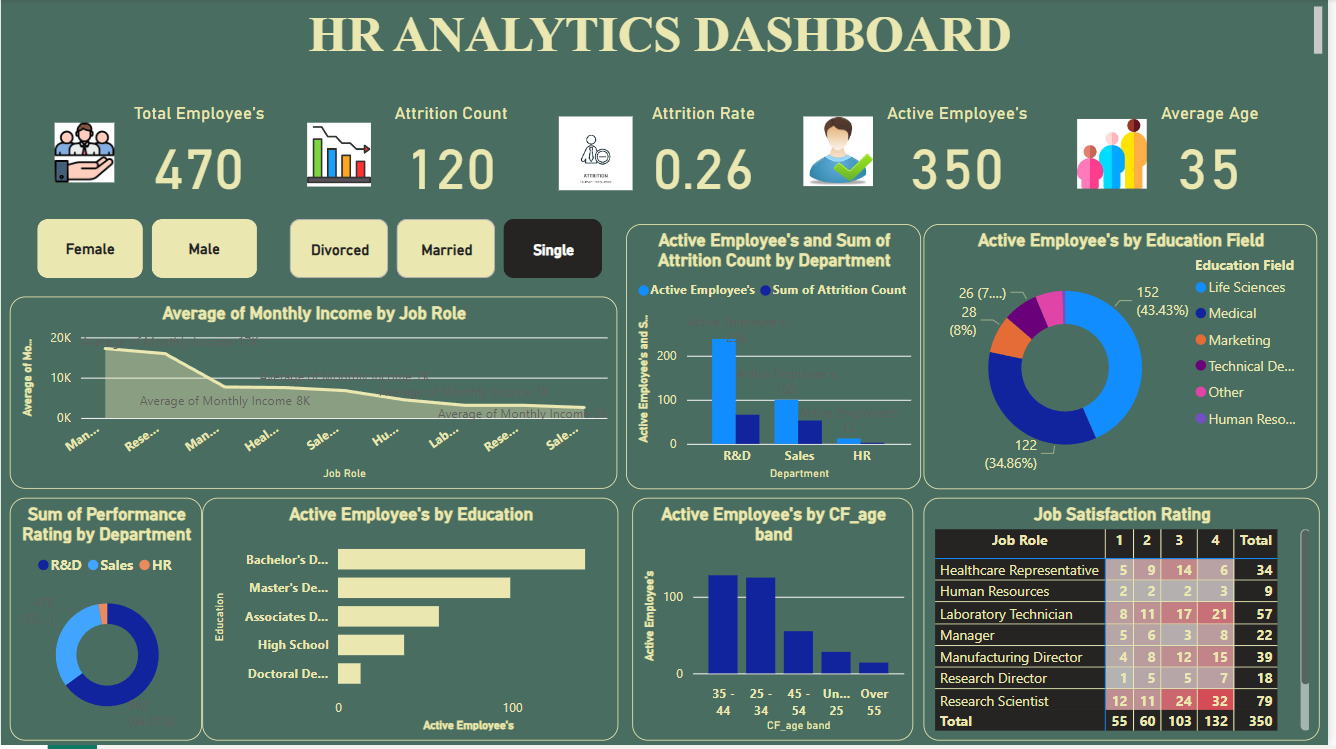
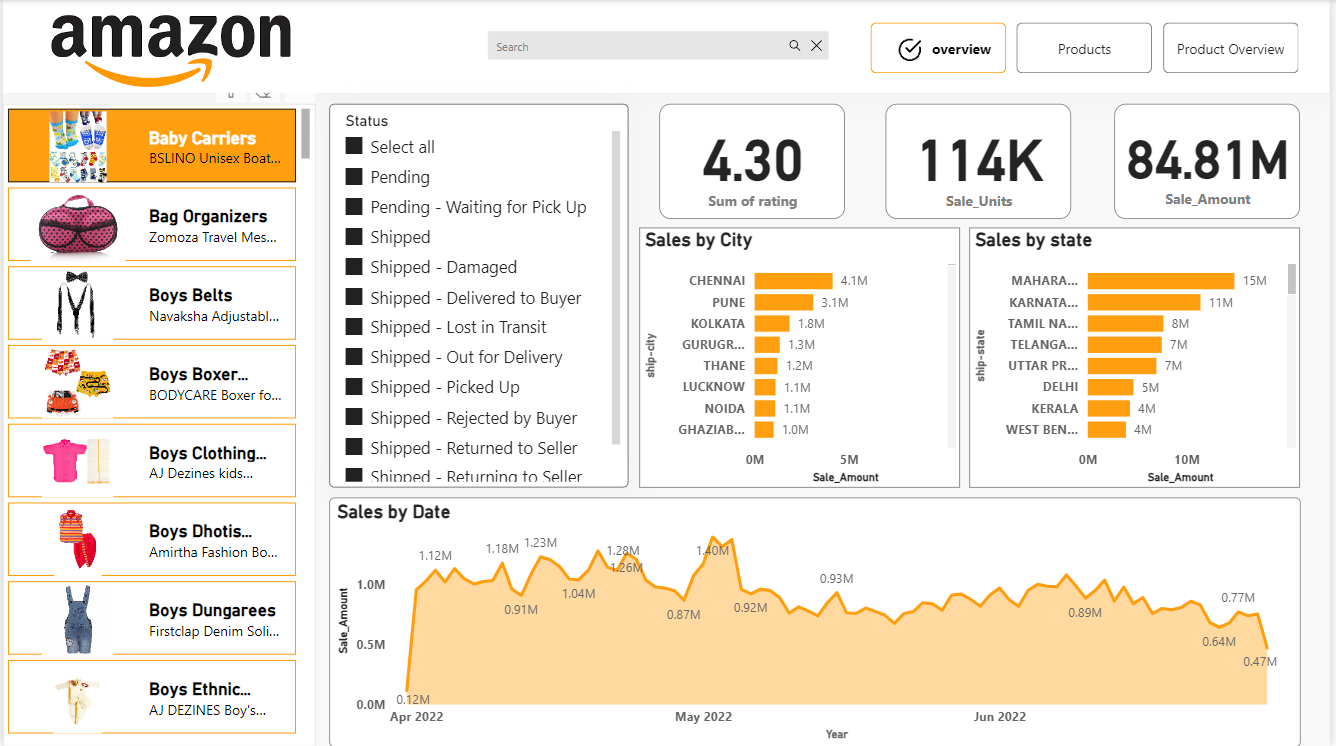
Our Superstore Sales Dashboard is a powerful tool designed to provide a comprehensive overview of sales performance across various dimensions. This interactive dashboard delivers real-time data visualization and analytics, enabling businesses to gain valuable insights and make informed decisions to drive growth and efficiency.
Key Features:
- Sales Overview: Get a high-level summary of total sales, quantity sold, and profit with real-time updates.
- Sales by Ship Mode: Analyze sales distribution across different shipping methods, including First Class, Second Class, and Standard Class.
- Sales by Region: Visualize regional sales performance, highlighting key areas of success.
- Sales by Segment: Understand sales contributions from different segments such as Home Office, Corporate, and Consumer.
- Sales by Sub-Category and Category: Drill down into specific product categories and sub-categories to identify top-performing items.
- Monthly and Yearly Trends: Track sales and profit trends over time, from January to December, across multiple years.
- Geographical Insights: Utilize a map to view sales and profit distribution by state, identifying regional trends and opportunities for growth.
This Superstore Sales Dashboard is designed to empower businesses with actionable insights, allowing for data-driven strategies and improved decision-making processes. With a user-friendly interface and customizable views, stakeholders can efficiently monitor sales performance and identify key areas for improvement and growth.


