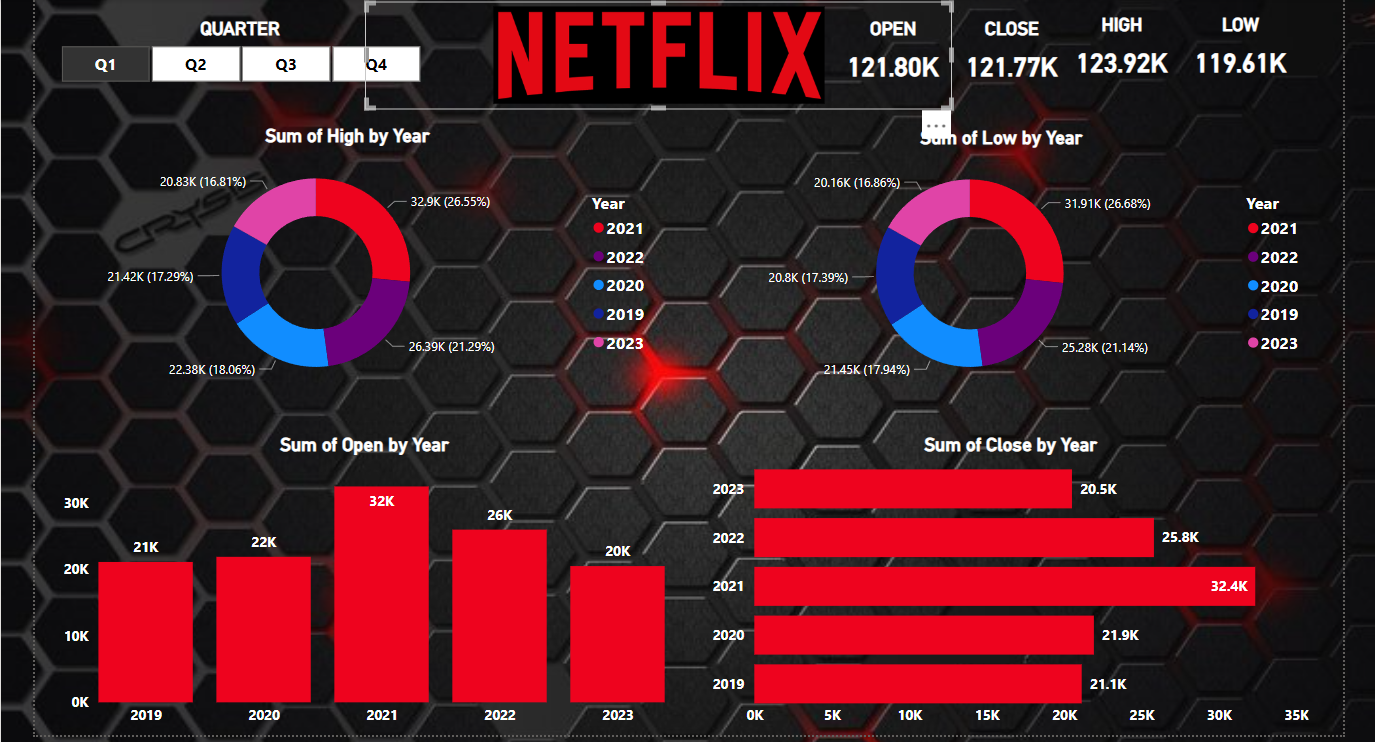
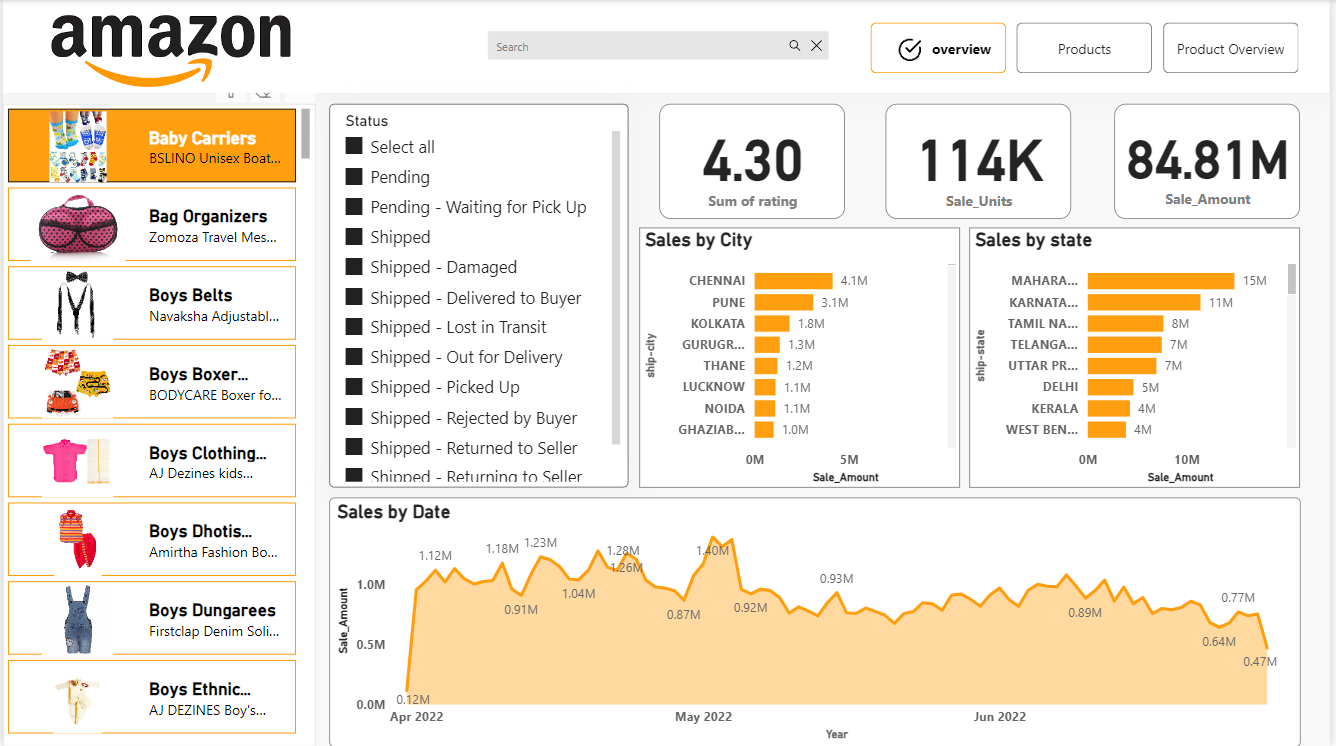
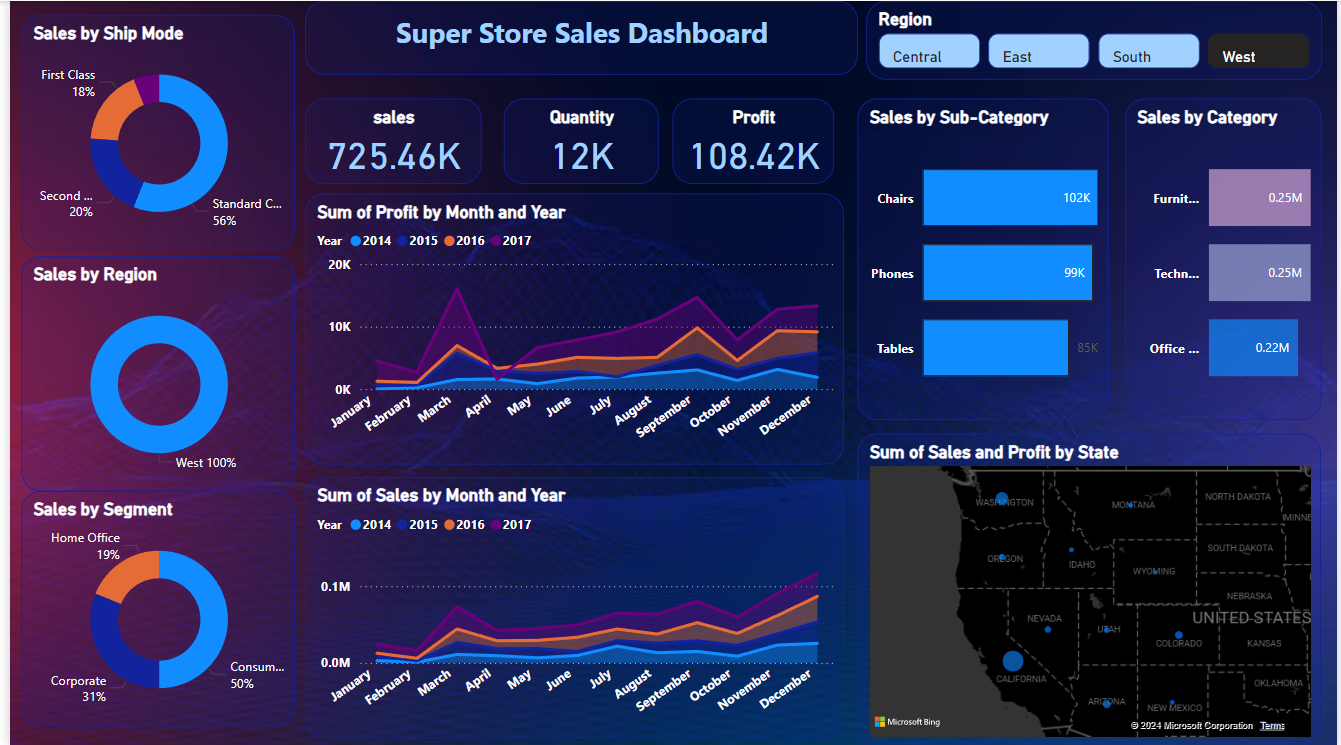
Our Netflix Stock Market Dashboard Project is designed to provide a comprehensive overview of Netflix’s stock performance and market trends. This interactive dashboard offers real-time data visualization and analytics, enabling users to monitor key metrics and make informed investment decisions.
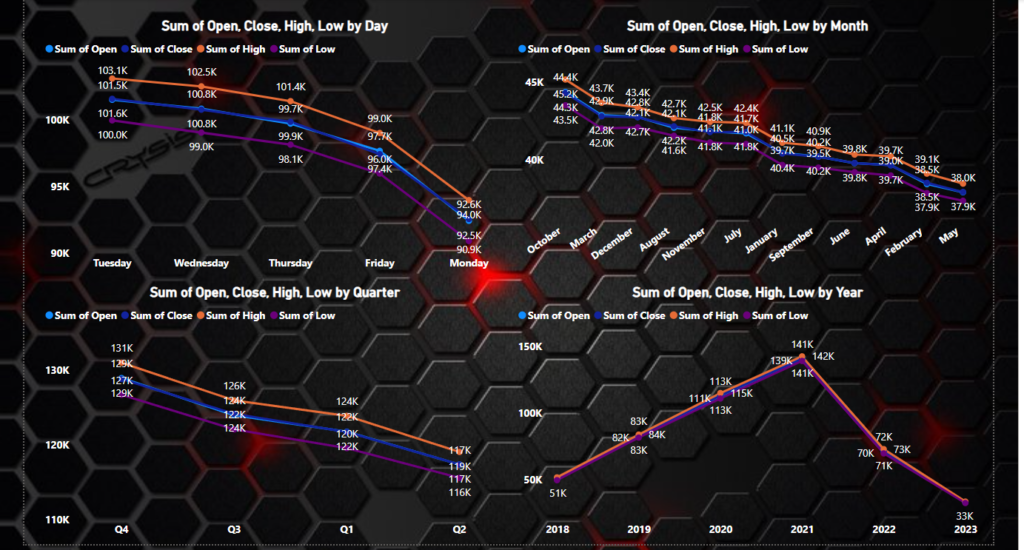
Key Features:
- Real-time Data Visualization: Track Netflix stock price movements and market trends with interactive charts and graphs.
- Historical Performance Analysis: Analyze historical data to understand stock price fluctuations and patterns over time.
- Financial Metrics: View key financial metrics such as market capitalization, P/E ratio, and earnings per share (EPS).
- Comparative Analysis: Compare Netflix’s performance with industry benchmarks and competitors.
- News and Insights: Stay updated with relevant news and insights impacting Netflix’s stock performance.
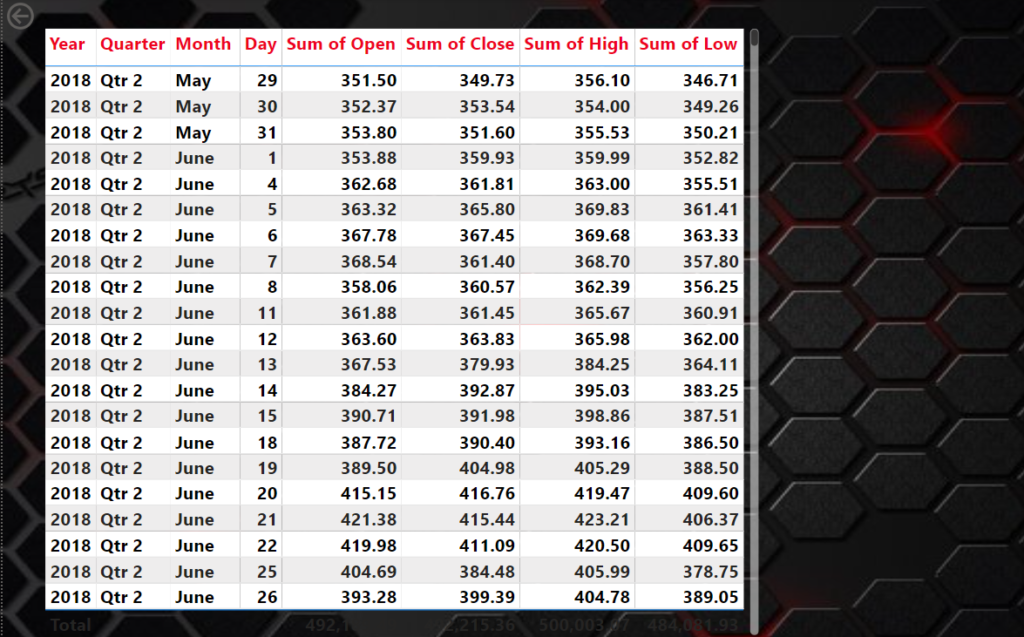
This dashboard project aims to empower investors and analysts with actionable insights, facilitating better investment strategies and informed decision-making in the dynamic stock market environment.


